
Acknowledgements
This blog was co-authored by Peter Wilson, Craig Ringer and Dave Lawson.
What is OpenTelemetry anyway?
OpenTelemetry, often shortened to OTel, is an open source project dedicated to generating, collecting, and exporting telemetry data. Its purpose is to enable communication between disparate tools from differing vendors. OpenTelemetry's popularity comes from its position as an open source, vendor neutral solution with a broad ecosystem of available tools, libraries and documented best practices.
It defines standards, including:
- a data format for describing telemetry data (logs, metrics, and traces);
- naming conventions for common telemetry data and metadata;
- a protocol (OTLP) for transmitting and receiving data;
- APIs and interface conventions for instrumenting applications to provide telemetry
The project also provides some concrete implementations, including:
- toolkits (SDKs) for adding telemetry to applications; and
- an OpenTelemetry collector multi-tool data collection/transform/routing utility.
The implementations are optional - you can implement OpenTelemetry in a product without using any of them, they make it easier and provide a reference implementation.
Read the project's own article to learn more.
Sidebar: OpenTelemetry vs the OpenTelemetry Collector
People often confuse OpenTelemetry (the protocol, data format, etc) with one specific implementation of them: the OpenTelemetry Collector.
The OpenTelemetry Collector is an agent used for collecting, processing, transforming and routing telemetry data. It is often the key component that is mentioned when talking about OpenTelemetry, offering a rich catalogue of plug-ins and the ability to relatively easily author new ones if the current catalogue is insufficient.
The collector is a multi-tool and a helper. You don't have to use it to support OpenTelemetry. If you do use it, that doesn't mean you actually support OpenTelemetry in your product. It just makes OpenTelemetry integration easier and provides some shared functionality for common tasks.
Why is OpenTelemetry valuable?
An open observability framework should lower the cost of ownership of telemetry tooling for organisations because of the existing ecosystem of tools and libraries, and do so without locking organisations in with a specific vendored solution. OpenTelemetry provides greater choice, flexibility and operability between tools by providing an open standard for transmitting telemetry data. This in turn reduces the risk of vendor lock-in and lowers the cost of ownership of telemetry tooling.
Great success!
... or is it? As things stand, OpenTelemetry provides a lot of value, but it can only solve some of the problems.
Using and consuming OpenTelemetry data
OpenTelemetry’s job is done once it has delivered the data to your chosen destination. Storing, querying, visualising, alerting on it and using it is up to you.
The Babel problem
OpenTelemetry naming conventions are just guidelines and only cover the most common cases, so tooling and exporters are often left to decide on naming and conventions for themselves. Many OpenTelemetry-compatible tools and implementations may be able to exchange telemetry data with each other without actually being understood by each other¹, producing a situation where tools speak the same language, as it were, but without sharing a common vocabulary.
OpenTelemetry’s naming conventions say little about specific applications (like the PostgreSQL server²) - and many applications don't document any of their own monitoring conventions. So every vendor and every metrics collection implementation comes up with its own independent ideas for what information to collect and what to call it³. This is problematic particularly in cases like PostgreSQL, where the application's native telemetry support is limited so telemetry is generated using external agents.
In practice, this means that when sending OpenTelemetry data to any monitoring stack (especially, but not only, proprietary SaaS vendor stacks):
- some built-in dashboards may be blank or incomplete (even for core things like k8s monitoring);
- associations between components, logs and metrics may not work, e.g. tools to view a dashboard relating to a specific log event, the host it is running on, or dashboards that show recent logs;
- the cost of receiving and using the data may vary depending on the solution you use. SaaS monitoring vendor billing is generally complex and varies wildly between vendors, e.g. one may bill metrics by number of unique time series, while another bills by raw data volume.
Even the open-source, non-SaaS stacks suffer from many of these same problems. Some stacks have better native support for OpenTelemetry data than others, but few if any deliver a satisfactory out-of-the-box user experience.
So what can OpenTelemetry do for me?
It depends, one does not simply implement Open Telemetry. The key to implementing OpenTelemetry, and observability in general, successfully is identifying your problem.
What problem is your organisation trying to solve?
"Implement OpenTelemetry" might be part of the answer, but you need to understand the question first.
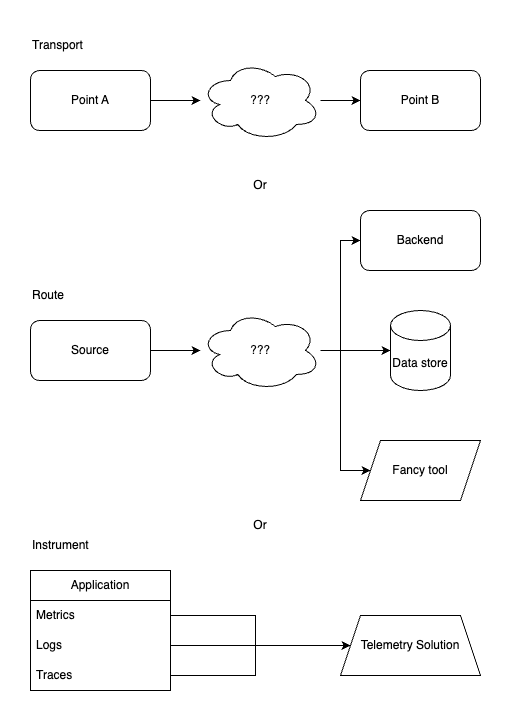
Do you primarily need a telemetry transport to move signals from point A to point B? Do you need telemetry to be routed to different backends and data stores? Do you need to instrument your applications so they natively emit metrics and traces? OpenTelemetry can help solve all of these problems, but they must be articulated and defined clearly, with metrics for success. If you can’t measure success, how will you know if you have achieved your goal?
This will also help in articulating the value of your proposal to use OpenTelemetry in your stack to the various stakeholders and hopefully drive adoption.
It is also necessary to understand the problems OpenTelemetry, specifically, cannot solve. If the problem your organisation faces is related to storing, visualising, alerting or otherwise acting upon telemetry signals, then OpenTelemetry is not the solution, or not the whole solution. OpenTelemetry may be useful to deliver telemetry to a backend in that case but will not, by itself, be able to act upon that data. For some tasks, using OpenTelemetry might even be more difficult and more limiting than using vendor-specific agents and integrations.
Finally, it is enormously important to understand that OpenTelemetry is a framework and ecosystem that provides one piece of a larger telemetry and observability pipeline, it is not, and cannot be a solution unto itself. It must be evaluated in the context of the rest of the tools in use and the desired outcomes.
Once you have these details locked down, it will help in navigating the different ways you can implement OpenTelemetry or leverage its tooling (whilst not specifically “implementing” it) to achieve your goal. There are quite a lot of options, probably too many to cover in this post. The project's documentation is the best place to start.
Future directions
Much of the PostgreSQL-specific friction described here could be improved if PostgreSQL had native OpenTelemetry support built into the database engine itself. This would provide a common language that all monitoring tools could be reasonably expected to consume.
It won't be perfect. Different Postgres management systems all have their own ways of handling replication, failover, distributed databases etc. That means there'll be different metadata, different ways of tracking primary <-> replica relationships, managing replication lag, and more. But even there the project could define its own semantic conventions to supplement the OpenTelemetry core ones, supplying a baseline for all implementers.
Meanwhile, we can hope that market pressure drives vendors to improve their native OpenTelemetry support so that OpenTelemetry data sources become an easier-to-integrate first-class citizen in their products. If OpenTelemetry doesn’t solve your problem today, even after giving it a try, it is definitely something you will want to keep an eye on and come back to. The work they are doing is amazing, and it is very exciting to watch it grow and gain broader adoption.
Notes
¹ This is a challenge that exists in other open source observability spaces as well. Prometheus telemetry is dependent on the conventions of the collectors and exporters. For example, it’s necessary to use visualisations and alerting written for a specific collector such as cAdvisor, as opposed to node-exporter or another option. Using dashboards written for a different exporter’s naming and labelling conventions will simply result in empty dashboards. Even though the data is present in the system and all being spoken in the same protocols and data representations, it’s not mutually comprehensible among the tools.
² The OpenTelemetry semantic conventions provide guidance for database clients including PostgreSQL clients, but they don't have anything to say (yet) about database servers.
³ E.g. one Postgres metrics data exporter might send a metric pg_stat_activity_count with label datname for the number of active queries. But the destination that's storing and querying it might expect to receive postgresql.active_queries with labels db, app, and user instead. The receiver won't understand the sender's data or know where to look for it, there's no standard to give them a common language, and they don't mean exactly the same thing because they're pre-aggregated on different dimensions. The receiver's dashboards and alerts just won't work.